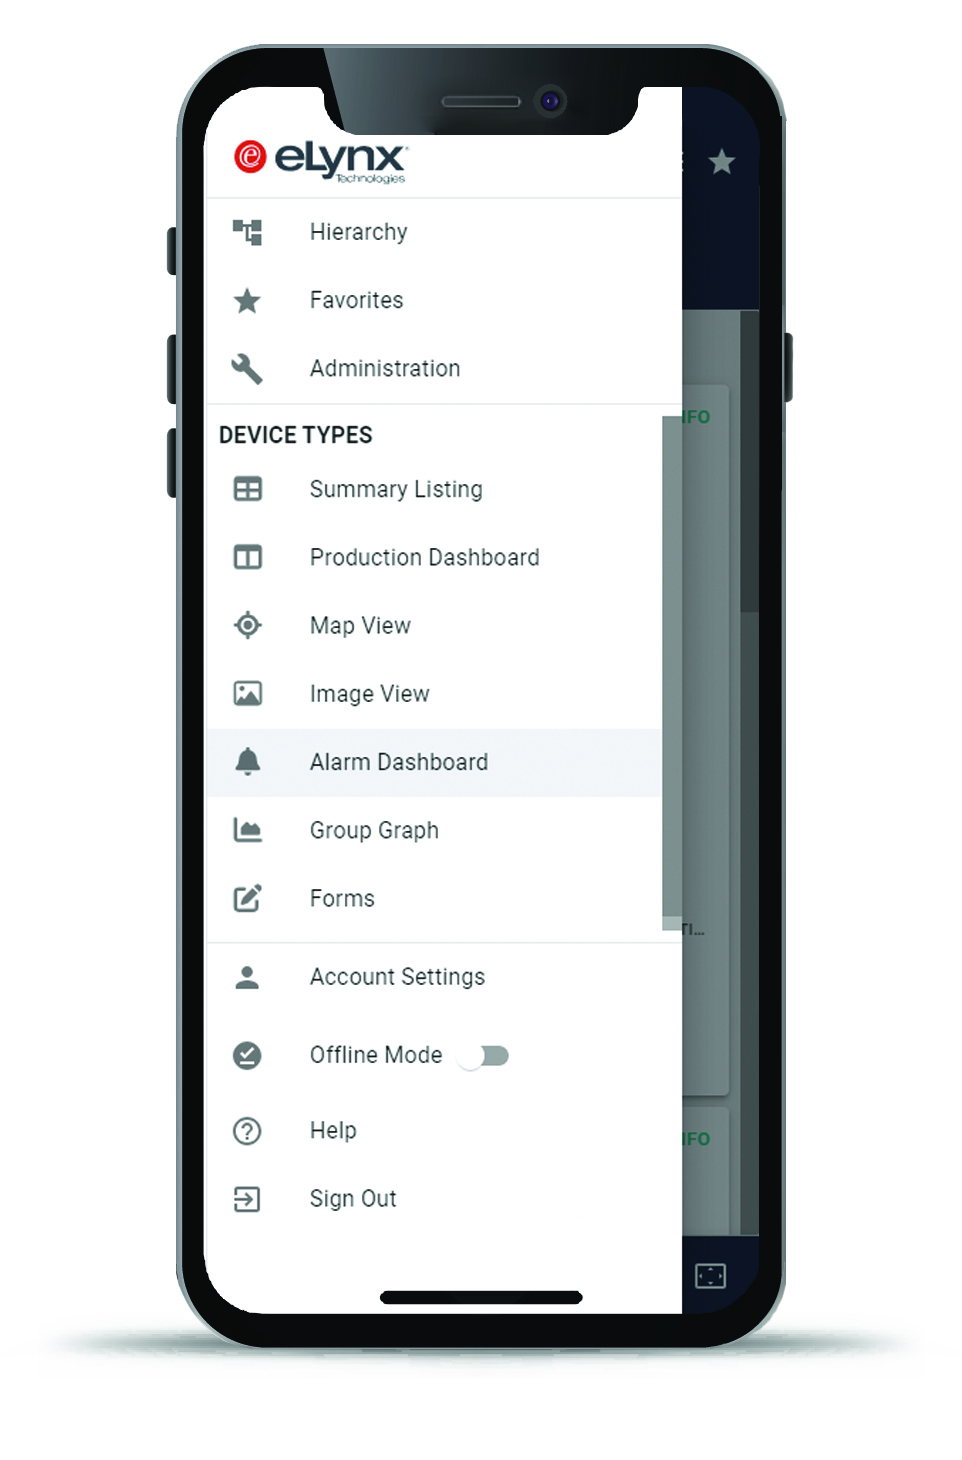
The eLynx Alarm Dashboard, a tool that was traditionally only available on desktop and in the Administration Menu, is NOW AVAILABLE in the Main Menu to users in the Mobile App! The Alarm Dashboard allows users quick access to view and manage alarms. This tool can help surface nuisance alarms, devices with potentially faulty hardware, and adjust the balance of alarm notifications between personnel, to maximize efficiency and reduce alarm fatigue.
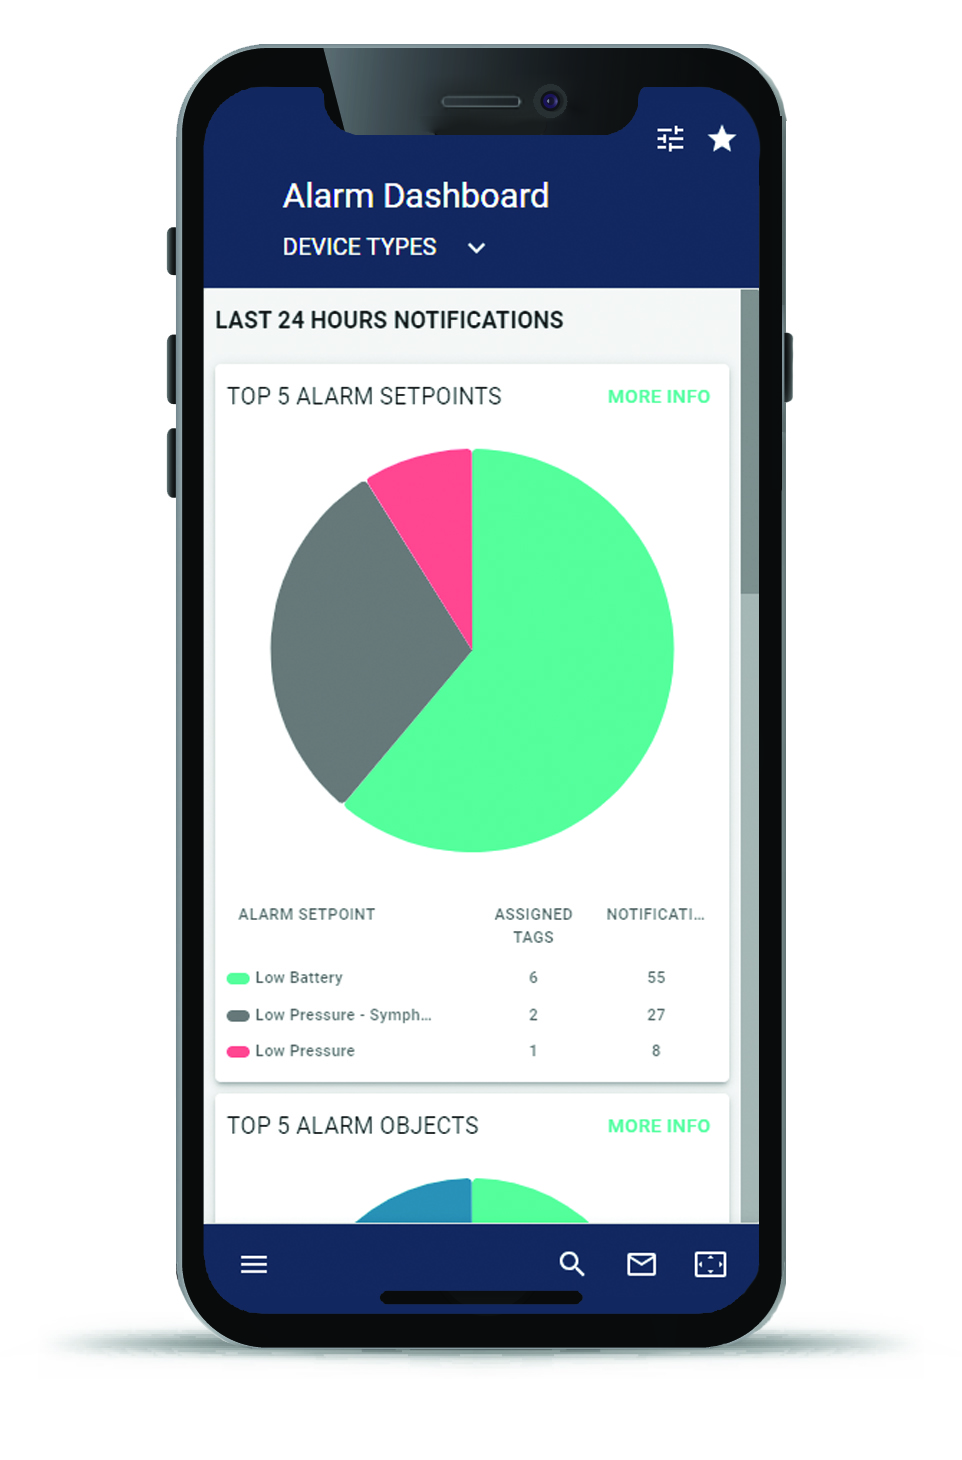
By default the Alarm Dashboard Displays data for the last 24 hours and has three main categories:
1. The 5 Setpoints with the most alarms.
2. The 5 Devices with the most alarms.
3. The 5 Recipients with the most notifications.
Note: These lists may not contain 5 entries if fewer matching items are found in the selected time period.
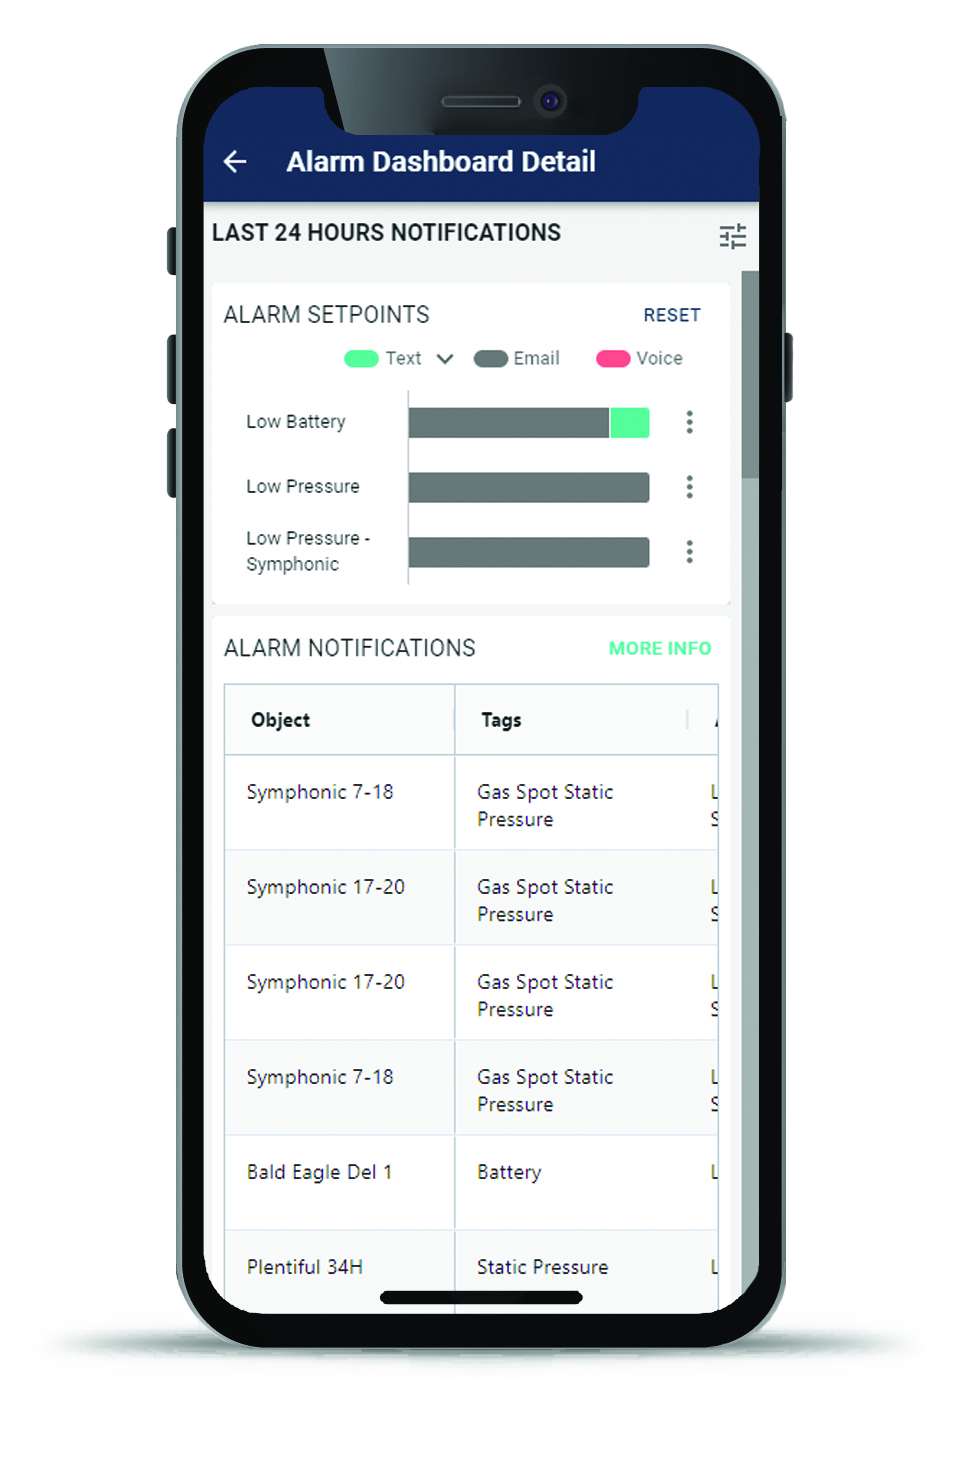
In addition, the dashboard shows a timeline for the last 24 hours, indicating what time of day and what type of notification (voice, email and text) is being sent.
To change the timeframe, or to filter the notification types, click the options icon in the upper right corner of the screen.
Clicking the "More Info" button in the upper right corner of each of the top 5 charts will take you to a screen which shows all items for the time period organized from highest usage to lowest. Clicking on any of the pie chart slices, or on a row in the legend, will take you to this same screen, with the matching filter already applied.
For more information on the Alarm Dashboard and Alarming in the mobile application, CLICK HERE.